
Last Updated: June 01, 2026
Beginner
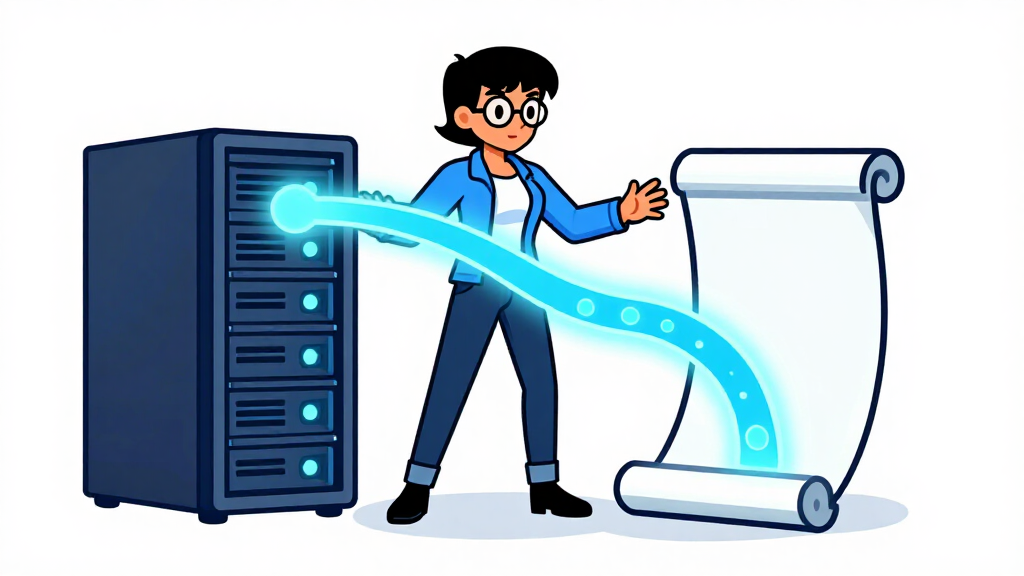
Twitter Bots can be super useful to help automate some of the interactions on social media in order to build and grow engagement but also automate some tasks. There has been many changes on the twitter developer account and sometimes it’s uncertain how to even create a tweet bot. This article will walk through step bey step on how to create a twitter bot with the latest Twitter API v2 and also provide some code you can copy and paste in your next project. We also end with how to create a more useful bot that can post some articles about python automatically.
In a nutshell, how a twitter bot works is that you will need to run your code for a twitter bot in your own compute that can be triggered from a Twitter webhook (not covered) which is called by twitter based on a given event, or by having your program run periodically to read and send tweets (covered in this article). Either way, there are some commonalities and in this article we will walk through how to read tweets, and then to send tweets which are from google news related to python!

Python developer and educator with 15+ years building production systems across data engineering, web APIs, and AI tooling. Founder of Python How To Program — 270+ in-depth tutorials covering the modern Python stack.
Step 1: Sign up for Developer program
If you haven’t already you will need to either sign in or sign up for a twitter account through twitter.com. Make sure your twitter account has an email address allocated to it (if you’re not aware, you can create a twitter account with just your mobile phone number)

Next go to developer.twitter.com and sign up for the developer program (yes, you need to sign up for a second time). This enables you to create applications.

First you’ll need to answer some questions on purpose of the developer account. You can chose “Make a Bot”

Next you will need to agree to the terms and conditions, and then a verification email will be sent to your email address from your twitter account.
When you click on the email to verify your account, you can then enter your app name. This is an internal name and something that will make it easy for you to reference.

Once you click on keys, you will then be given a set of security token keys like below. Please copy them in a safe place as your python code will need to use them to access your specific bot. If you do lose your keys, or someone gets access to them for some reason, you can generate new keys from your developer.twitter.com console.
There are two keys which you will need to use:
- API Key (think of this like a username)
- API Key Secret (think of this like a password)
- Bearer Token (used for read queries such as getting latest tweets)
There is also a third key, a Bearer Token, but this you can ignore. It is for certain types of requests

At the bottom of the screen you’ll see a “Skip to Dashboard”, when you click on that you’ll then see the overview of your API metrics.
Within this screen you can see the limits of the number of calls per month for example and how much you have already consumed.

Next, click on the project and we have to generate the access tokens. Currently with the previous keys you can only read tweets, you cannot create ones as yet.
After clicking on the project, chose the “keys and tokens” tab and at the bottom you can generate the “Access Tokens”. In this screen you can also re-generate the API Keys and Bearer Token you just created before in case your keys were compromised or you forgot them.

Just like before, generate the keys and copy them.

By now, you have 5 security toknes:
- API Key – also known as the Consumer Key (think of this like a username)
- API Key Secret – also known as the Consumer Secret (think of this like a password)
- Bearer Token (used for read queries such as getting latest tweets)
- Access Token (‘username’ to allow you to create tweets)
- Access Token Secret (‘password’ to allow you to create tweets)
Step 2: Test your twitter API query
Now that you have the API keys, you can do some tests. If you are using a linux based machine you can use the curl command to do a query. Otherwise, you can use a site such as https://reqbin.com/curl to do an online curl request.
Here’s a simple example to get the most recent tweets. It uses the API https://api.twitter.com/2/tweets/search/recent which must include the query keyword which includes a range of parameter options (find out the list in the twitter query documentation).
curl --request GET 'https://api.twitter.com/2/tweets/search/recent?query=from:pythonhowtocode' --header 'Authorization: Bearer <your bearer token from step 1>'The output is as follows:
{
    "data": [{
        "id": "1523251860110405633",
        "text": "See our latest article on THE complete beginner guide on creating a #discord #bot in #python \n\nEasily add this to your #100DaysOfCode  #100daysofcodechallenge #100daysofpython \n\nhttps://t.co/4WKvDVh1g9"
    }],
    "meta": {
        "newest_id": "1523251860110405633",
        "oldest_id": "1523251860110405633",
        "result_count": 1
    }
}
Here’s a much more complex example. This includes the following parameters:
%23– which is the escape characters for#and searches for hashtags. Below example is hashtag#python(case insensitive)%20– this is an escape character for a space and separates different filters with anANDoperation-is:retweet– this excludes retweets. The ‘-‘ sign preceding theisnegates the actual filter-is:reply– this excludes replies. The ‘-‘ sign preceding theisnegates the actual filtermax_results=20– an integer that defines the maximum number of return results and in this case 20 resultsexpansions=author_id– this makes sure to include the username internal twitter id and also the actual username under anincludessection at the bottom of the returned JSONtweet.fields=public_metrics,created_at– returns the interaction metrics such as number of likes, number of retweets, etc as well as the time (in GMT timezone) when the tweet was createduser.fields=created_at,location– this returns when the user account was created and the user self-reported location in their profile.
curl --request GET 'https://api.twitter.com/2/tweets/search/recent?query=%23python%20-is:retweet%20-is:reply&max_results=20&expansions=author_id&tweet.fields=public_metrics,created_at&user.fields=created_at,location' --header 'Authorization: Bearer <Your Bearer Token from Step 1>'Result of this looks like the following – notice that the username details is in the includes section below where you can link the tweet with the username with the author_id field.
{{
    "data": [{
        "id": "1523688996676812800",
        "text": "NEED a #JOB?\nSign up now https://t.co/o7lVlsl75X\nFREE. NO MIDDLEMEN\n#Jobs #AI #DataAnalytics #MachineLearning #Python #JavaScript #WomenWhoCode #Programming #Coding #100DaysofCode #DEVCommunity #gamedev #gamedevelopment #indiedev #IndieGameDev #Mobile #gamers #RHOP #BTC #ETH #SOL https://t.co/kMYD2417jR",
        "author_id": "1332714745871421443",
        "public_metrics": {
            "retweet_count": 3,
            "reply_count": 0,
            "like_count": 0,
            "quote_count": 0
        },
        "created_at": "2022-05-09T15:39:00.000Z"
    },
....
  }],
    "includes": {
        "users": [{
            "name": "Job Preference",
            "id": "1332714745871421443",
            "username": "JobPreference",
            "created_at": "2020-11-28T15:56:01.000Z"
        },
....
}
Step 3: Reading tweets with python code
Building on top of the tests conducted on Step 2, it is a simple extra step in order to convert this to python code using the requests module which we’ll show first and after show a simpler way with the library tweepy. You can simply use the library to convert the curl command into a bit of python code. Here’s a structured version of this code where the logic is encapsulated in a class.
import requests, json
from  urllib.parse import quote
from pprint import pprint

class TwitterBot():
    URL_SEARCH_RECENT = 'https://api.twitter.com/2/tweets/search/recent'
    def __init__(self, bearer_key):
        self.bearer_key = bearer_key

    def search_recent(self, query, include_retweets=False, include_replies=False):
        url = self.URL_SEARCH_RECENT + "?query=" + quote(query)
        if not include_retweets: url += quote(' ')+'-is:retweet'
        if not include_replies: url += quote(' ')+'-is:reply'

        url += '&max_results=20&expansions=author_id&tweet.fields=public_metrics,created_at&user.fields=created_at,location'

        headers = {'Authorization': 'Bearer ' + self.bearer_key }

        r = requests.get(url, headers = headers)
        r.encoding = r.apparent_encoding.  #Ensure to use UTF-8 if unicode characters
        return json.loads(r.text)

#create an instance and pass in your Bearer Token
t = TwitterBot('<Insert your Bearer Token from Step 1>')
pprint( t.search_recent( '#python') )
The above code is fairly straightforward and does the following:
TwitterBot class– this class encapsulates the logic to send the API requestsTwitterBot.search_recent– this method takes in the query string, then escapes any special characters, then calls therequests.get()to call thehttps://api.twitter.com/2/tweets/search/recentAPI callpprint()– this simply prints the output in a more readable format
This is the output:


However, there is a simpler way which is to use tweepy.
pip install tweepyNext you can use the tweepy module to search recent tweets:
import tweepy

client = tweepy.Client(bearer_token='<insert your token here from previous step>')

query = '#python -is:retweet -is:reply' #exclude retweets and replies with '-'
tweets = client.search_recent_tweets(   query=query,
                                        tweet_fields=['public_metrics', 'context_annotations', 'created_at'],
                                        user_fields=['username','created_at','location'],
                                        expansions=['entities.mentions.username','author_id'],
                                        max_results=10)
#The details of the users is in the 'includes' list
user_data = {}
for raw_user in tweets.includes['users']:
    user_data[ raw_user.id ] = raw_user

for index, tweet in enumerate(tweets.data):
    print(f"[{index}]::@{user_data[tweet.author_id]['username']}::{tweet.created_at}::{tweet.text.strip()}\n")
    print("------------------------------------------------------------------------------")
Output as follows:

Please note, that after calling the API a few times your number of tweets consumed will have increased and may have hit the limit. You can always visit the dashboard at https://developer.twitter.com/en/portal/dashboard to see how many requests have been consumed. Notice, that this does not count the number of actual API calls but the actual number of tweets. So it can get consumed pretty quickly.

Step 4: Sending out a tweet
So far we’ve only been reading tweets. In order to send a tweet you can use the create_tweet() function of tweepy.
client = tweepy.Client( consumer_key= "<API key from above - see step 1>",
                        consumer_secret= "<API Key secret - see step 1>",
                        access_token= "<Access Token - see step 1>",
                        access_token_secret= "<Access Token Secret - see step 1>")


# Replace the text with whatever you want to Tweet about
response = client.create_tweet(text='A little girl walks into a pet shop and asks for a bunny. The worker says” the fluffy white one or the fluffy brown one”? The girl then says, I don’t think my python really cares.')

print(response)
Output from Console:

Output from Twitter:

How to Send Automated Tweets About the Latest News
To make this a bit more of a useful bot rather than simply tweet out static text, we’ll make it tweet about the latest things happened in the news about python.
In order to search for news information, you can use the python library pygooglenews
pip install pygooglenewsThe library searches Google news RSS feed and was developed by Artem Bugara. You can see the full article of he developed the Google News library. You can put in a keyword and also time horizon to make it work. Here’s an example to find the latest python articles in last 24 hours.
from pygooglenews import GoogleNews
gn = GoogleNews()
search = gn.search('python programming', when = '12h')

for article in search['entries']:
    print(article.title)
    print(article.published)
    print(article.source.title)
    print('-'*80)  #string multiplier - show '-' 80 times
Here’s the output:

So, the idea would be to show a random article on the twitter bot which is related to python programming. The gn.search() functions returns a list of all the articles under the entries dictionary item which has a list of those articles. We will simply pick a random one and construct the tweet with the article title and the link to the article.
import tweepy
from pygooglenews import GoogleNews
from random import randint

client = tweepy.Client( consumer_key= "<your consumer/API key - see step 1>",
                        consumer_secret= "<your consumer/API secret - see step 1>",
                        access_token= "<your access token key - see step 1>",
                        access_token_secret= "<your access token secret - see step 1>")

gn = GoogleNews()
search = gn.search('python programming', when = '24h')

#Find random article in last 24 hours using randint between index 0 and the last index
article = search['entries'][ randint( 0, len( search['entries'])-1 ) ]

#construct the tweet text
tweet_text =  f"In python news: {article.title}.  See full article: {article.link}.  #python #pythonprogramming"

#Fire off the tweet!
response = client.create_tweet( tweet_text )
print(response)
Output from the console on the return result:

And, most importantly, here’s the tweet from our @pythonhowtocode! Twitter automatically pulled the article image

This has currently been scheduled as a daily background job!

How To Use MarkItDown to Convert Documents to Markdown for LLMs
Intermediate
You have a folder of PDFs, Word documents, and PowerPoint decks that you need to feed into an LLM pipeline — a RAG system, a document summarizer, or a knowledge base builder. The problem is that LLMs work best with plain text, and most documents are packed with binary formatting, embedded fonts, and layout metadata that the model cannot interpret. Sending a raw PDF to an LLM is like handing someone a ZIP file and asking them to read it.
Microsoft’s markitdown library solves this by converting dozens of file formats — PDF, DOCX, PPTX, XLSX, HTML, CSV, EPUB, images, and audio — into clean Markdown that any LLM can process. It is a single pip install, works from Python code or the command line, and handles the conversion pipeline so your code does not have to. The Markdown output preserves headings, tables, and code blocks in a structured format that models handle especially well.
This article covers everything you need to get documents into your AI pipelines with MarkItDown. You will learn how to install it, convert individual files and entire directories, work with the Python API, handle different file types, and build a real document-processing pipeline that prepares files for a RAG system. By the end you will have a working utility that accepts any folder of mixed-format documents and outputs a structured Markdown dataset ready for embedding.
MarkItDown: Quick Example
Before diving into the details, here is the fastest path from a file to Markdown text you can feed into an LLM. This example converts an HTML page to Markdown in four lines of Python.
# quick_markitdown.py
from markitdown import MarkItDown

md = MarkItDown()
result = md.convert("https://example.com")
print(result.text_content[:500])
Output:
Example Domain
==============

This domain is for use in illustrative examples in documents. You may use this
domain in literature without prior coordination or asking for permission.

[More information...](https://www.iana.org/domains/reserved)
The MarkItDown() constructor creates a converter instance, and convert() accepts a file path, a URL, or a file-like object. The result is a DocumentConverterResult object — result.text_content holds the clean Markdown string ready to pass into any LLM or text processing pipeline.
The real power emerges when you need to handle PDFs, Office files, and mixed directories at scale. The sections below cover all of that, starting with installation.
What Is MarkItDown and Why Use It?
MarkItDown is an open-source Python library from Microsoft that acts as a universal document-to-Markdown converter. Think of it as a universal adapter — on one end you plug in a document in almost any format, and on the other end you get clean, structured Markdown text. The library was built specifically with LLM use cases in mind: the Markdown output is structured in a way that helps models understand document hierarchy (headings, tables, code blocks) rather than receiving a flat blob of text.
The key difference from alternatives like pypdf2 or python-docx is breadth and consistency. Those libraries require a different API for each format, handle only one format each, and return raw extracted text with no structure. MarkItDown gives you one API that handles all formats and preserves semantic structure as Markdown.
| Format | MarkItDown | pypdf2 / python-docx / openpyxl |
|---|---|---|
| Yes | pypdf2 only | |
| DOCX | Yes | python-docx only |
| PPTX | Yes | python-pptx only |
| XLSX | Yes | openpyxl only |
| HTML / URL | Yes | No |
| EPUB | Yes | No |
| CSV / JSON | Yes | No |
| Images (OCR) | Yes (optional) | No |
| Audio (transcription) | Yes (optional) | No |
| Unified output format | Markdown | Raw text / format-specific objects |
The optional image OCR and audio transcription require extra dependencies (and an LLM API key for the best results), but the core document converters — PDF, Office, HTML — work completely offline with no API key required. That makes MarkItDown an excellent fit for any pipeline where you control the infrastructure.
Installing MarkItDown
MarkItDown is on PyPI. A basic install that handles PDFs, Office documents, and HTML covers most use cases and has minimal dependencies.
# Install the base package
pip install markitdown

# For PDF support (pdfminer.six is included in most installs)
pip install markitdown[pdf]

# For all optional extras (OCR, audio, Azure Document Intelligence)
pip install markitdown[all]
Output:
Successfully installed markitdown-0.1.1 pdfminer.six-20221105 ...
The [pdf] extra pulls in pdfminer.six for text-based PDF extraction. If you need image OCR within PDFs, you will also need an LLM plugin (covered in the advanced section). For most document-to-Markdown pipelines the base install is all you need — it handles DOCX, PPTX, XLSX, HTML, CSV, JSON, and EPUB without any extras.

Converting Files, URLs, and Streams
The MarkItDown class is the main entry point. It auto-detects the file format based on extension or MIME type, so you call the same method regardless of what you are converting.
Converting a Local File
Pass any local file path as a string. MarkItDown detects the format automatically and returns a DocumentConverterResult.
# convert_file.py
from markitdown import MarkItDown

md = MarkItDown()

# Convert a DOCX file
result = md.convert("report.docx")
print(f"Title: {result.title}")
print(f"Characters: {len(result.text_content)}")
print()
print(result.text_content[:300])
Output:
Title: Q3 Sales Report
Characters: 4821

# Q3 Sales Report

**Prepared by:** Finance Team
**Date:** September 30, 2025

## Executive Summary

Revenue grew 12% year-over-year driven by the enterprise segment...
The result.title property extracts the document title from metadata where available (DOCX, PDF). The text_content property always holds the full Markdown string. Notice that the headings from the Word document are preserved as Markdown heading levels — this is exactly the structural information that LLMs use to understand document hierarchy.
Converting a URL
Pass a URL string and MarkItDown fetches the page and converts the HTML to Markdown. This works especially well for documentation pages, Wikipedia articles, and any page with semantic HTML structure.
# convert_url.py
from markitdown import MarkItDown

md = MarkItDown()
result = md.convert("https://docs.python.org/3/library/json.html")

print(result.text_content[:600])
Output:
json --- JSON encoder and decoder
=================================

**Source code:** [Lib/json/__init__.py](https://github.com/python/cpython/tree/3.13/Lib/json/__init__.py)

JSON (JavaScript Object Notation), specified by [RFC 7159](https://datatracker.ietf.org/doc/html/rfc7159.html)...

## json.dumps(obj, *, skipkeys=False, ...)

Serialize obj to a JSON formatted str...
Navigation menus, footers, and sidebars are typically stripped out, leaving the actual content. This makes URL conversion a fast way to pull documentation into a RAG corpus without building a custom scraper for every site.
Converting from a File-Like Object
When you receive a file as bytes (from an API response, an email attachment, or a web upload), you can convert it directly from a BytesIO object without writing it to disk first.
# convert_stream.py
import io
from markitdown import MarkItDown
import requests

md = MarkItDown()

# Download a PDF into memory and convert without saving to disk
response = requests.get("https://www.w3.org/WAI/WCAG21/wcag21.pdf")
pdf_stream = io.BytesIO(response.content)

# Must pass extension hint when using streams -- no filename to detect from
result = md.convert(pdf_stream, file_extension=".pdf")
print(f"Converted {len(result.text_content)} characters from in-memory PDF")
print(result.text_content[:400])
Output:
Converted 87432 characters from in-memory PDF

Web Content Accessibility Guidelines (WCAG) 2.1
================================================

W3C Recommendation 05 June 2018

Abstract
--------

Web Content Accessibility Guidelines (WCAG) 2.1 covers a wide range of...
The file_extension parameter is required when passing a stream because there is no filename to inspect. Always include it for streams to ensure the correct converter is selected.
Format-Specific Conversion Options
Most formats work out of the box, but a few have options worth knowing about. PowerPoint files get per-slide conversion, Excel files convert to Markdown tables, and PDFs expose page-level control.
Excel and CSV to Markdown Tables
Excel sheets are converted to Markdown tables — one table per worksheet. This is particularly useful when feeding structured data to LLMs that need to reason about tabular information.
# convert_excel.py
from markitdown import MarkItDown

md = MarkItDown()
result = md.convert("sales_data.xlsx")
print(result.text_content)
Output (example with a two-sheet workbook):
## Sheet1

| Month | Revenue | Units |
|-------|---------|-------|
| Jan   | 84000   | 420   |
| Feb   | 91200   | 456   |
| Mar   | 78500   | 392   |

## Sheet2

| Region | Manager | Target |
|--------|---------|--------|
| East   | Alice   | 100000 |
| West   | Bob     | 95000  |
Each worksheet becomes an H2 section followed by a Markdown table. LLMs handle this format well for question-answering tasks — the model can identify column headers, filter by region, and compute simple aggregations when the data is in this structured Markdown table format rather than raw CSV text.
PowerPoint Slide Extraction
PPTX files are converted slide by slide. Each slide becomes a section with its title as a heading and the body text extracted below it. Speaker notes are included when present.
# convert_pptx.py
from markitdown import MarkItDown

md = MarkItDown()
result = md.convert("product_roadmap.pptx")

# Show first 500 chars to see the structure
print(result.text_content[:500])
Output:
## Slide 1: Product Roadmap 2026

Vision: Ship the AI-native workflow layer by Q3.

- Q1: Core infrastructure and auth
- Q2: Integration layer + partner APIs
- Q3: Public launch
- Q4: Enterprise tier

**Notes:** Emphasize the partnership angle -- this is key differentiator vs competitors.

## Slide 2: Q1 Milestones

- Authentication service -- 95% complete
- Database migration -- in progress
...
Speaker notes appear as bold “Notes:” blocks after each slide’s content. For meeting-notes pipelines or sales-deck summarizers this is especially useful — you get the full context that the presenter intended to convey, not just the bullet points on the slide.

Batch Converting a Directory
Real pipelines rarely deal with a single file. Here is a pattern to convert every supported file in a directory, log any failures, and save all results to a single Markdown file for easy embedding.
# batch_convert.py
import os
from pathlib import Path
from markitdown import MarkItDown

SUPPORTED = {".pdf", ".docx", ".pptx", ".xlsx", ".html", ".csv", ".json", ".epub"}

def batch_convert(input_dir: str, output_path: str) -> dict:
    """Convert all supported files in input_dir to a single Markdown file."""
    md = MarkItDown()
    results = {"success": [], "failed": []}
    output_parts = []

    for fpath in sorted(Path(input_dir).rglob("*")):
        if fpath.suffix.lower() not in SUPPORTED:
            continue

        print(f"Converting: {fpath.name}")
        try:
            result = md.convert(str(fpath))
            # Separate each document with a clear section header
            section = f"\n\n---\n## Document: {fpath.name}\n\n{result.text_content}"
            output_parts.append(section)
            results["success"].append(str(fpath))
        except Exception as exc:
            print(f"  FAILED: {exc}")
            results["failed"].append({"file": str(fpath), "error": str(exc)})

    with open(output_path, "w", encoding="utf-8") as f:
        f.write("# Document Corpus\n")
        f.write(f"Converted {len(results['success'])} documents.\n")
        f.write("".join(output_parts))

    return results


if __name__ == "__main__":
    stats = batch_convert("./docs", "corpus.md")
    print(f"\nDone: {len(stats['success'])} converted, {len(stats['failed'])} failed")
Output:
Converting: annual_report.pdf
Converting: onboarding.docx
Converting: roadmap.pptx
Converting: q3_data.xlsx
  FAILED: File appears to be encrypted

Done: 3 converted, 1 failed
The try/except around each conversion is essential — encrypted PDFs, corrupted files, or unsupported subtypes will raise exceptions rather than silently producing empty output. The pattern above logs the failure and continues with the rest of the batch, which is the right behavior for any automated pipeline. The output corpus.md contains all documents separated by clear section dividers that chunk-based RAG systems can split on.
Using MarkItDown with LLM Pipelines
The most common use case is feeding converted documents into an LLM. Here is how to wire MarkItDown into an OpenAI-compatible pipeline for a simple document Q&A pattern.
# doc_qa.py
from markitdown import MarkItDown
from openai import OpenAI

def answer_from_document(file_path: str, question: str, api_key: str) -> str:
    """Convert a document to Markdown and answer a question about it."""
    md = MarkItDown()
    result = md.convert(file_path)
    doc_text = result.text_content

    # Truncate if the document exceeds a safe context window size
    max_chars = 80000  # ~20K tokens for most models
    if len(doc_text) > max_chars:
        doc_text = doc_text[:max_chars] + "\n\n[Document truncated...]"

    client = OpenAI(api_key=api_key)
    response = client.chat.completions.create(
        model="gpt-4o-mini",
        messages=[
            {
                "role": "system",
                "content": "You are a document analyst. Answer questions based only on the provided document.",
            },
            {
                "role": "user",
                "content": f"Document:\n\n{doc_text}\n\nQuestion: {question}",
            },
        ],
    )
    return response.choices[0].message.content


# Example usage
answer = answer_from_document(
    "contract.pdf",
    "What is the termination clause?",
    api_key="your-openai-api-key"
)
print(answer)
Output:
Section 12.3 of the contract states that either party may terminate this agreement
with 30 days written notice. Termination for cause requires only 5 business days
notice and must be accompanied by written documentation of the breach.
This pattern works with any OpenAI-compatible API — swap the base URL and API key for Anthropic, Gemini, or a local Ollama endpoint and the pattern is identical. The key insight is that MarkItDown’s Markdown output is substantially better context than raw extracted text because the model can use heading levels and table structure to locate specific sections of long documents.

Real-Life Example: Building a Document Corpus Preparer for RAG
This project ties together everything from this article. It accepts a folder of mixed-format documents, converts all of them to Markdown, chunks the output into LLM-ready segments, and saves a JSON file that a vector database like Chroma or Pinecone can ingest directly.
# rag_preparer.py
import json
import os
from pathlib import Path
from markitdown import MarkItDown

SUPPORTED = {".pdf", ".docx", ".pptx", ".xlsx", ".html", ".csv", ".epub"}
CHUNK_SIZE = 1500   # characters per chunk (~375 tokens)
CHUNK_OVERLAP = 150 # overlap so context is not lost at boundaries


def chunk_text(text: str, size: int = CHUNK_SIZE, overlap: int = CHUNK_OVERLAP) -> list:
    """Split text into overlapping chunks."""
    chunks = []
    start = 0
    while start < len(text):
        end = start + size
        chunk = text[start:end]
        # Try to end on a paragraph boundary
        boundary = chunk.rfind("\n\n")
        if boundary > size // 2:
            chunk = chunk[:boundary]
        chunks.append(chunk.strip())
        start += len(chunk) - overlap
    return [c for c in chunks if len(c) > 50]  # drop tiny trailing chunks


def prepare_rag_corpus(docs_dir: str, output_path: str) -> None:
    md = MarkItDown()
    corpus = []
    chunk_id = 0

    for fpath in sorted(Path(docs_dir).rglob("*")):
        if fpath.suffix.lower() not in SUPPORTED:
            continue

        print(f"Processing: {fpath.name}")
        try:
            result = md.convert(str(fpath))
            chunks = chunk_text(result.text_content)
            for i, chunk in enumerate(chunks):
                corpus.append({
                    "id": f"chunk_{chunk_id:05d}",
                    "source_file": fpath.name,
                    "source_title": result.title or fpath.stem,
                    "chunk_index": i,
                    "total_chunks": len(chunks),
                    "text": chunk,
                })
                chunk_id += 1
            print(f"  -> {len(chunks)} chunks")
        except Exception as exc:
            print(f"  FAILED: {exc}")

    with open(output_path, "w", encoding="utf-8") as f:
        json.dump(corpus, f, indent=2, ensure_ascii=False)

    print(f"\nCorpus saved: {len(corpus)} chunks from {chunk_id} total across all docs")
    print(f"Output: {output_path}")


if __name__ == "__main__":
    prepare_rag_corpus("./knowledge_base", "rag_corpus.json")
Output:
Processing: company_handbook.pdf
  -> 47 chunks
Processing: product_specs.docx
  -> 18 chunks
Processing: roadmap_2026.pptx
  -> 9 chunks
Processing: pricing.xlsx
  -> 3 chunks

Corpus saved: 77 chunks from 77 total across all docs
Output: rag_corpus.json
The output rag_corpus.json is ready to embed. Each chunk carries its source file and title as metadata, so your vector database can filter by document when answering queries that should be scoped to a specific source. The overlapping chunks prevent context loss at boundaries — a sentence that straddles a chunk boundary will appear in both adjacent chunks, so the model always sees complete context around any retrieved passage. To extend this project, add an embedding step using sentence-transformers or the OpenAI Embeddings API and pipe the corpus directly into your vector store of choice.
Frequently Asked Questions
Can MarkItDown convert password-protected PDFs?
No — password-protected PDFs raise an exception during conversion because the underlying pdfminer.six library cannot read encrypted content without the password. You will see a PDFPasswordIncorrect or PDFEncryptionError. The fix is to pre-decrypt the PDF before conversion using a library like pikepdf: open with the password and save a decrypted copy, then convert the decrypted file. Always wrap conversion in try/except in batch pipelines so a single locked file does not abort the entire run.
Does MarkItDown extract images from PDFs?
With the base install, MarkItDown extracts text from PDFs but skips embedded images. If your PDFs are scanned documents (images of text, not actual text layers), the base converter will return little or no content. For scanned PDFs you need to add an LLM plugin — MarkItDown supports Azure Document Intelligence and OpenAI Vision as optional backends that can OCR images within documents. Pass an llm_client and llm_model to the MarkItDown constructor to enable this. The optional dependency install is pip install markitdown[all].
How should I handle very large documents?
For documents that produce more than 100,000 characters of Markdown, pass the whole text to an LLM in a single call only if your model supports a large context window (128K+). Otherwise, use the chunking pattern from the real-life example above — split the Markdown at paragraph boundaries with a 10% overlap and embed the chunks rather than the whole document. MarkItDown itself handles arbitrarily large files without issue; the bottleneck is always the downstream LLM context window, not the conversion step.
How well does MarkItDown handle complex tables?
Simple flat tables — with consistent column counts and no merged cells — convert reliably to Markdown tables. Complex tables with merged headers, multi-row cells, or heavily styled cells may produce irregular Markdown. Excel files generally convert better than Word or PDF tables because the underlying data is already structured. If you find table output unreliable for a specific document type, consider using openpyxl or python-docx for that format and MarkItDown for everything else in the same pipeline.
Can I stream the conversion output?
MarkItDown does not support streaming output — the convert() call blocks until the full document is converted and returns the complete result. For large documents this can take several seconds, especially for multi-hundred-page PDFs. If you need non-blocking behavior in an async pipeline, wrap the conversion in asyncio.run_in_executor() to run it in a thread pool and await the result without blocking your event loop.
Can I add a custom converter for a format MarkItDown does not support?
Yes — MarkItDown has a plugin system. You can register a custom DocumentConverter subclass for any file extension. Implement the convert() method that accepts a file path and returns a DocumentConverterResult, then register it via md.register_converter(MyConverter()). This is useful for proprietary formats specific to your industry — medical records in HL7, CAD files, or internal XML schemas — where you have the parsing logic but need to plug it into the same batch pipeline that handles standard formats.
Conclusion
MarkItDown removes the most painful part of building LLM document pipelines: writing and maintaining a different parser for every file format. A single MarkItDown().convert() call handles PDFs, DOCX, PPTX, XLSX, HTML, CSV, EPUB, and more, returning clean Markdown that LLMs can reason over rather than raw binary or poorly-structured text. The real-life example above gives you a complete RAG corpus preparer that you can extend — add an embedding step, plug in a vector store, or swap in a different chunking strategy depending on your document types.
The next step is to test it on your actual document set. Run the batch converter, inspect the output Markdown for any formatting issues specific to your files, and tune the chunk size to match your embedding model’s token limit. For OCR-heavy or audio transcription pipelines, explore the optional llm_client parameter to unlock MarkItDown’s full feature set.
Official documentation and source: github.com/microsoft/markitdown. PyPI package: pypi.org/project/markitdown/.
Related Articles
Further Reading: For more details, see the Python HTTP client documentation.
Pro Tips for Building a Better Twitter Bot
1. Respect Rate Limits with Exponential Backoff
The Twitter API enforces strict rate limits. Instead of crashing when you hit one, implement exponential backoff to retry gracefully. Wrap your API calls in a retry function that doubles the wait time after each failed attempt, starting from 1 second up to a maximum of 64 seconds. This keeps your bot running reliably without getting your credentials revoked.
# rate_limit_handler.py
import time
import requests

def api_call_with_backoff(url, headers, max_retries=5):
    wait_time = 1
    for attempt in range(max_retries):
        response = requests.get(url, headers=headers)
        if response.status_code == 200:
            return response.json()
        elif response.status_code == 429:
            print(f"Rate limited. Waiting {wait_time}s...")
            time.sleep(wait_time)
            wait_time = min(wait_time * 2, 64)
        else:
            response.raise_for_status()
    raise Exception("Max retries exceeded")
Output:
Rate limited. Waiting 1s...
Rate limited. Waiting 2s...
{'data': [{'id': '1234567890', 'text': 'Hello world'}]}
2. Never Hardcode API Keys
Store your API credentials in environment variables or a .env file, never in your source code. If you accidentally push hardcoded keys to a public GitHub repo, bots will find and abuse them within minutes. Use the python-dotenv library to load credentials from a .env file that you add to your .gitignore.
# secure_credentials.py
import os
from dotenv import load_dotenv

load_dotenv()

BEARER_TOKEN = os.getenv("TWITTER_BEARER_TOKEN")
API_KEY = os.getenv("TWITTER_API_KEY")
API_SECRET = os.getenv("TWITTER_API_SECRET")

if not BEARER_TOKEN:
    raise ValueError("TWITTER_BEARER_TOKEN not set in .env file")
3. Add Logging Instead of Print Statements
Replace print() calls with Python’s built-in logging module. Logging gives you timestamps, severity levels, and the ability to write to files — essential for debugging a bot that runs unattended. When your bot tweets something unexpected at 3 AM, logs are the only way to figure out what happened.
# bot_with_logging.py
import logging

logging.basicConfig(
    level=logging.INFO,
    format="%(asctime)s [%(levelname)s] %(message)s",
    handlers=[
        logging.FileHandler("bot.log"),
        logging.StreamHandler()
    ]
)

logger = logging.getLogger(__name__)
logger.info("Bot started successfully")
logger.warning("Approaching rate limit: 14/15 requests used")
logger.error("Failed to post tweet: 403 Forbidden")
Output:
2026-03-26 10:15:30 [INFO] Bot started successfully
2026-03-26 10:15:31 [WARNING] Approaching rate limit: 14/15 requests used
2026-03-26 10:15:32 [ERROR] Failed to post tweet: 403 Forbidden
4. Track Posted Content to Avoid Duplicates
Bots that post the same content repeatedly get flagged and suspended. Keep a simple record of what you have already tweeted using a JSON file or SQLite database. Before posting, check if the content has been posted before. This is especially important for news bots that might encounter the same story from multiple sources.
5. Use a Scheduler for Consistent Posting
Instead of running your bot in a loop with time.sleep(), use a proper scheduler like schedule or APScheduler. Schedulers handle timing more reliably, support cron-like expressions, and make it easy to run different tasks at different intervals. For production bots, consider using system-level scheduling with cron (Linux) or Task Scheduler (Windows).
Frequently Asked Questions
Can I still build a Twitter bot with the API?
Yes, but access has changed. The free tier of the X (formerly Twitter) API v2 allows basic posting. For reading tweets or higher volume, you need a paid plan. Check current pricing at developer.x.com.
What Python library should I use for the Twitter/X API?
Use tweepy for the most mature Python wrapper with v2 API support. It handles OAuth 2.0 authentication, rate limiting, and provides clean methods for posting, searching, and streaming.
How do I authenticate with the Twitter API v2?
Use OAuth 2.0 Bearer Token for read-only access or OAuth 1.0a for posting. Generate credentials in the X Developer Portal, then pass them to tweepy.Client().
What are the rate limits for the Twitter API?
Rate limits vary by endpoint and plan. The free tier allows 1,500 tweets per month. Always implement rate limit handling with tweepy’s wait_on_rate_limit=True.
What can a Twitter bot do?
Bots can auto-post content, reply to mentions, retweet by keyword, track hashtags, analyze sentiment, and provide automated responses. Always follow the X API terms of service.
Related Articles
- How To Build a Discord Bot with Python
- How To Handle API Rate Limits in Python
- How To Use Python Requests for REST APIs
Continue Learning Python
Tutorials you might also find useful:
Hey,
Thank you so much! I have tried sample codes from other tutorials, including twitter API documentation and none of that really worked. Your code works nice, thank you really.
David
Thanks for the feedback, glad it was helpful.