
Last Updated: June 01, 2026
Advanced
Making computer generated text mimic human speech is fascinating and actually not that difficult for an effect that is sometimes convincing, but certainly entertaining. Markov Chain’s is one way to do this. It works by generating new text based on historical texts where the original sequencing of neighboring words (or groups of words) is used to generate meaningful sentences. Read the below guide on how to code a Markov Chain text generator (code example in python) including explanation of the concept.
What’s really interesting, is that you can take historical texts of a person, then generate new sentences which can sound similar to the way that person speaks. Alternatively, you can combine texts from two different people and get a mixed “voice”.
I played around this with texts of speeches from two great presidents:

What my Markov Chain generated which was “trained” using the combination of texts from Obama speeches and Bartlet scripts, is as follows:
- ‘Can I burn my mother in North Carolina for giving us a great night planned.’
- ‘And so going forward, I believe that we can build a bomb into their church.’
- ‘’Charlie, my father had grown up in the Situation Room every time I came in.’’
- ‘This campaign must be ballistic.’,

Python developer and educator with 15+ years building production systems across data engineering, web APIs, and AI tooling. Founder of Python How To Program — 270+ in-depth tutorials covering the modern Python stack.
What is a Markov Chain in the context of a text generation?
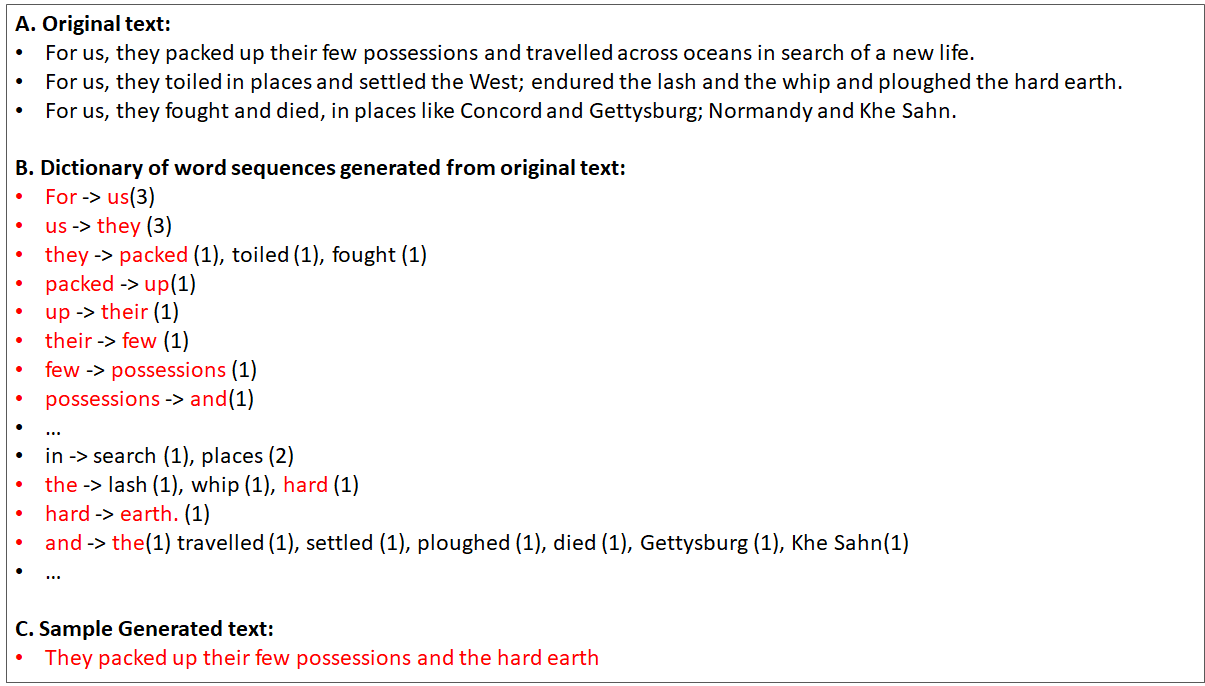
For a more technical explanation, I think you can find plenty of resources out there. In simple terms, it is an algorithm which is used to generate a new outcome from a weighted list of words based on historical texts. Now that’s rather abstract. In more practical terms, in the scenario for text generation, it is a way to use historical texts, chop it up into individual words (or sets of words), and then randomly chose a given word then randomly chose the next likely words based on historical sequences. For example:
This doesn’t just apply in text as well (although one of the most popular applications is in your smart phone where there’s predictive text), it can be used for any scenario where you use historical information to define next steps for a given state. For example, you could codify a given stock market pattern (such as the % daily changes for the last 30 days), then use that to see historically what was the likely next day outcome (example only.. I’m very doubtful how effective it would be).
Why are Markov Chain Text Generators so fun?
I’ve always wanted to build a text generator as it’s just an awesome way to see how you could mimic intelligence using a very cheap shortcut. You’ll see the algorithm below, and it is super simple. The other fact is that, like above example, you can use it to mix the ‘voice’ from two different persons and see the outcome.
How does the Markov Chain Text Generator work?
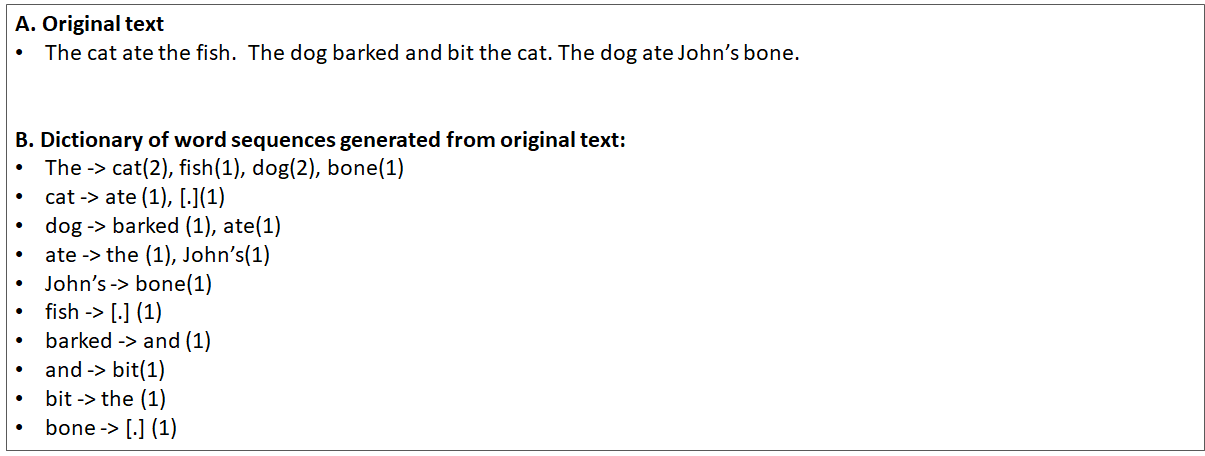
There are two phases for text generation with Markov Chains. There’s first the ‘dictionary build phase’ which involves gathering the historical texts, and then generating a dictionary with the key being a given word in a sentence, and then having the resultant being the natural follow-up words.
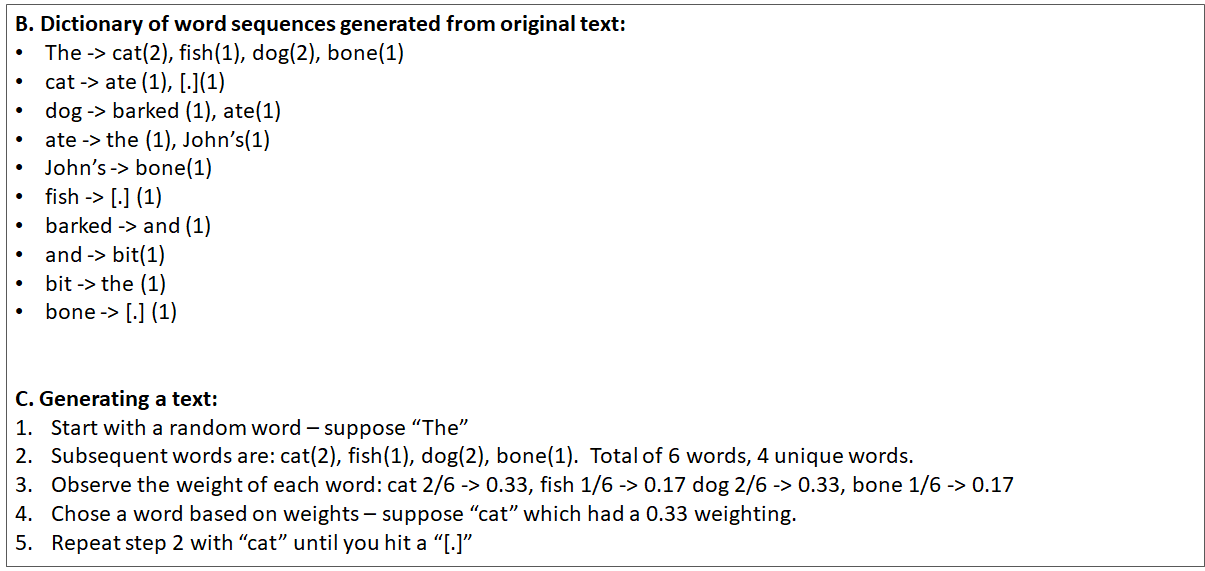
The second is the execution, where you start from a given word, then use that word to see what the next word would be in a probabilistic way. For example:
Now, there are some tricks which you need to be mindful of ( I found this out the hard way):
- You can’t start from any random word — if you do, then you’ll get sentences like this: “ate the cat.” . You have to keep track of “starting words” to keep things simple — hence you can have: “John ate the cat”.
- Don’t ignore punctuation— if you do remove punctuation, you’ll get sentence like this: “The dog barked at John cat”. Instead keep them there so that you can have a better chance to have a more realistic sentence — i.e. “The dog barked at John’s ca”
- End on a full-stop word. When you go through and start from a word, then find the next word, then find the next word and so on, you can continue until you reach a specified length, but then you’ll end up stopping in mid-sentence such as this: “The cat ate John’s”. Instead, simply end when you have a word that has a full stop (another reason not to remove the punctuation) — i.e. “The cat ate John’s boots.”
Markov Chain Example Code Source texts
I played around with different texts including: Eddie Murphy stand-up routines, Donald Trump tweets, Obama speeches, and Jed Bartlet dialogue. You can find the the markov chain example source text here. It’s great to use one source and then generate the dictionary, but then you can mix and match and use two sources (e.g. Obama and Bartlet) and then create the one dictionary file. Then when you traverse the dictionary you get the both voices.
It is important to make sure that you can balance the text — e.g. if you had a 8000 text from Obama and only 1000 text from Eddie Murphy, it’s likely that you would see more of the Obama words. Of course, when you build the dictionary, you can also add some artificial weighting towards the lighter text source to balance things out.
Markov Chain Summary
The Markov Chain text generator is not perfect — you’ll see when you create your own, that some text is just gibberish. The more text that you have the better. Secondly, using single words is not helpful in the dictionary — you should use groups of 2–3 words. The actual number depends on how much historical text you have.
You can find all the python code, source texts and Markov Chain python example code here. Good luck!
Subscribe to our newsletter

How To Use Narwhals for DataFrame-Agnostic Python Code
Intermediate
You write a data processing function in pandas. It works great. Then a teammate switches the project to polars for performance reasons, and suddenly half your pipeline is broken. Or you maintain an open-source library that accepts a DataFrame as input — except now you need to support pandas, polars, and maybe cuDF for GPU users, which means three different code paths for what is essentially the same logic. This is the DataFrame fragmentation problem, and it gets more painful the more libraries you support.
Narwhals is a lightweight compatibility layer that lets you write DataFrame code once and run it on pandas, polars, modin, cuDF, and any other compliant backend. Instead of writing df.rename(columns={"old": "new"}) for pandas and df.rename({"old": "new"}) for polars, you write the Narwhals version once and it dispatches to the correct backend automatically. The library has zero mandatory dependencies — if the user passes in a pandas DataFrame, Narwhals uses pandas; if they pass in a polars DataFrame, it uses polars. Your code never needs to know which one it received.
This article covers everything you need to start writing DataFrame-agnostic Python code with Narwhals. You will learn how to install it, wrap inputs with narwhals.from_native(), use the Narwhals expression API for filtering, grouping, and aggregation, write backend-agnostic library functions, and handle the conversion back to native DataFrames. By the end you will have a working data pipeline that runs identically on pandas and polars without a single if isinstance check.
Narwhals DataFrame-Agnostic Code: Quick Example
Here is the shortest possible demonstration of the core idea. The function below accepts any supported DataFrame, filters rows, and returns a result — without knowing or caring whether the caller passed in pandas or polars.
# quick_narwhals.py
import narwhals as nw
import pandas as pd
import polars as pl

def get_high_earners(df_native, threshold=70000):
    df = nw.from_native(df_native)
    result = df.filter(nw.col("salary") > threshold)
    return nw.to_native(result)

# Works with pandas
pandas_df = pd.DataFrame({"name": ["Alice", "Bob", "Carol"], "salary": [90000, 55000, 80000]})
print(get_high_earners(pandas_df))

# Works with polars -- same function, no changes
polars_df = pl.DataFrame({"name": ["Alice", "Bob", "Carol"], "salary": [90000, 55000, 80000]})
print(get_high_earners(polars_df))
Output (pandas call):
    name  salary
0  Alice   90000
2  Carol   80000
Output (polars call):
shape: (2, 2)
+-------+--------+
| name  | salary |
| str   | i64    |
+=======+========+
| Alice | 90000  |
| Carol | 80000  |
+-------+--------+
The pattern is always the same three steps: wrap the native DataFrame with nw.from_native(), apply your transformations using Narwhals expressions, then call nw.to_native() to hand back a DataFrame in whichever format the caller originally provided. The function has no idea what backend it is working with — and it does not need to.
The sections below cover the full expression API, how to use Narwhals inside library functions, groupby and aggregation, schema inspection, and a real-world pipeline that processes sales data from either backend. Read on for the complete picture.
What Is Narwhals and Why Use It?
Narwhals is a thin compatibility layer for the Python DataFrame ecosystem. Think of it as a universal remote control — different devices (pandas, polars, modin), one set of buttons. Under the hood it translates each Narwhals expression into the equivalent native call on whichever backend is in use. When you write nw.col("price").mean(), Narwhals emits df["price"].mean() for pandas and pl.col("price").mean() for polars. The translation is handled for you.
The primary use case is writing libraries and utilities that accept a DataFrame from a caller you do not control. If you write a data validation function, a feature-engineering helper, or a report generator, you probably do not want to force all your users onto a single DataFrame library. Narwhals lets you accept whatever they have and return the same type back.
| Feature | Narwhals | pandas only | polars only |
|---|---|---|---|
| Works with pandas | Yes | Yes | No |
| Works with polars | Yes | No | Yes |
| Works with modin/cuDF | Yes | Partial | No |
| Unified expression API | Yes | No | No |
| Zero mandatory deps | Yes | No | No |
| Returns caller’s type | Yes | N/A | N/A |
Narwhals is not a replacement for polars or pandas — it is a wrapper you use at the boundaries of your code where the input DataFrame type is unknown. Your internal data-science scripts where you know the type should still use pandas or polars directly. Narwhals earns its place in shared utilities, open-source libraries, and pipelines that need to support multiple backends without duplication.

Installing Narwhals
Narwhals is on PyPI. It has no mandatory runtime dependencies — the only packages it imports are the ones your caller already has installed.
# Install narwhals
pip install narwhals

# Install your backends of choice (narwhals works with whichever you have)
pip install pandas polars
Output:
Successfully installed narwhals-1.x.xVerify the install and check which backends are detectable:
# check_narwhals.py
import narwhals as nw
print("Narwhals version:", nw.__version__)

# Check available backends
import importlib
for backend in ["pandas", "polars", "modin.pandas", "cudf"]:
    available = importlib.util.find_spec(backend.split(".")[0]) is not None
    print(f"  {backend}: {'available' if available else 'not installed'}")
Output:
Narwhals version: 1.x.x
  pandas: available
  polars: available
  modin.pandas: not installed
  cudf: not installed
You need at least one DataFrame backend installed. Narwhals itself imports in milliseconds and adds no overhead to import time for packages that depend on it.
Wrapping and Unwrapping DataFrames
Every Narwhals operation starts with nw.from_native() and usually ends with nw.to_native(). Understanding these two functions is the foundation of the entire library.
Converting In: nw.from_native()
nw.from_native() wraps any supported native DataFrame or Series in a Narwhals proxy object. The proxy exposes a consistent API regardless of what is underneath. You can pass eager_only=True to restrict the function to eager DataFrames (pandas, polars eager) and get better type hints.
# wrapping.py
import narwhals as nw
import pandas as pd
import polars as pl

# Wrap a pandas DataFrame
pdf = pd.DataFrame({"x": [1, 2, 3], "y": [4, 5, 6]})
ndf_pd = nw.from_native(pdf, eager_only=True)
print(type(ndf_pd))        # narwhals DataFrame
print(ndf_pd.schema)       # {'x': Int64, 'y': Int64}

# Wrap a polars DataFrame -- same API
plf = pl.DataFrame({"x": [1, 2, 3], "y": [4, 5, 6]})
ndf_pl = nw.from_native(plf, eager_only=True)
print(type(ndf_pl))        # narwhals DataFrame
print(ndf_pl.schema)       # {'x': Int64, 'y': Int64}
Output:
<class 'narwhals.dataframe.DataFrame'>
{'x': Int64, 'y': Int64}
<class 'narwhals.dataframe.DataFrame'>
{'x': Int64, 'y': Int64}
Both DataFrames produce the same Narwhals type with the same schema representation. From this point on, any operation you perform on ndf_pd and ndf_pl uses the same Narwhals method calls — no if isinstance branching needed.
Converting Out: nw.to_native()
nw.to_native() unwraps the Narwhals proxy and returns the underlying native DataFrame. The returned type matches whatever was passed in originally — if you wrapped a pandas DataFrame, you get a pandas DataFrame back; if you wrapped polars, you get polars back. This is how you preserve the caller’s type through a transformation pipeline.
# unwrapping.py
import narwhals as nw
import pandas as pd
import polars as pl

def double_x(df_native):
    df = nw.from_native(df_native, eager_only=True)
    result = df.with_columns((nw.col("x") * 2).alias("x_doubled"))
    return nw.to_native(result)

pdf = pd.DataFrame({"x": [1, 2, 3]})
plf = pl.DataFrame({"x": [1, 2, 3]})

pd_result = double_x(pdf)
pl_result = double_x(plf)

print(type(pd_result))   # pandas DataFrame
print(type(pl_result))   # polars DataFrame
print(pd_result)
print(pl_result)
Output:
<class 'pandas.core.frame.DataFrame'>
<class 'polars.dataframe.frame.DataFrame'>
   x  x_doubled
0  1          2
1  2          4
2  3          6
shape: (3, 2)
+---------+-----------+
| x       | x_doubled |
| i64     | i64       |
+=========+===========+
| 1       | 2         |
| 2       | 4         |
| 3       | 6         |
+---------+-----------+
The function returns whatever type it received. Callers do not need to convert their data before calling your function, and they do not need to convert the result afterward — it comes back in the form they expected.

Using the Narwhals Expression API
The Narwhals expression system works like polars expressions: you build a lazy description of a computation using nw.col(), and the DataFrame executes it when you call a method like filter(), select(), or with_columns(). This is more composable than pandas’ method chains and translates cleanly to both backends.
Filtering and Selecting Columns
Use df.filter() to keep rows matching a condition, and df.select() to choose and rename columns. Both accept Narwhals expressions built with nw.col().
# filter_select.py
import narwhals as nw
import pandas as pd

data = {
    "product": ["Laptop", "Monitor", "Keyboard", "Mouse", "Webcam"],
    "price": [1200, 450, 80, 35, 120],
    "units_sold": [15, 30, 200, 350, 80],
}
df = nw.from_native(pd.DataFrame(data), eager_only=True)

# Filter: only products that sold more than 50 units
popular = df.filter(nw.col("units_sold") > 50)
print("Popular products:")
print(nw.to_native(popular))

# Select: build a revenue column and return two columns
revenue = df.select(
    nw.col("product"),
    (nw.col("price") * nw.col("units_sold")).alias("revenue"),
)
print("\nRevenue by product:")
print(nw.to_native(revenue))
Output:
Popular products:
    product  price  units_sold
1   Monitor    450          30
2  Keyboard     80         200
4    Webcam    120          80

Revenue by product:
    product  revenue
0    Laptop    18000
1   Monitor    13500
2  Keyboard    16000
3     Mouse    12250
4    Webcam     9600
Notice that the filter and select expressions read identically regardless of backend. The same code works on a polars DataFrame with no changes. Narwhals translates nw.col("units_sold") > 50 to the correct native expression at call time.
Adding and Transforming Columns
df.with_columns() adds new columns or replaces existing ones without dropping the rest of the DataFrame. It accepts a list of Narwhals expressions and is the equivalent of pandas’ df.assign() or polars’ df.with_columns().
# with_columns.py
import narwhals as nw
import polars as pl

df = nw.from_native(
    pl.DataFrame({
        "name": ["Alice", "Bob", "Carol", "Dave"],
        "score": [82, 67, 91, 74],
        "attempts": [3, 5, 2, 4],
    }),
    eager_only=True,
)

enriched = df.with_columns(
    (nw.col("score") / nw.col("attempts")).round(1).alias("score_per_attempt"),
    (nw.col("score") >= 80).alias("passed"),
)
print(nw.to_native(enriched))
Output:
shape: (4, 5)
+-------+-------+----------+-------------------+--------+
| name  | score | attempts | score_per_attempt | passed |
| str   | i64   | i64      | f64               | bool   |
+=======+=======+==========+===================+========+
| Alice |    82 |        3 |              27.3 | true   |
| Bob   |    67 |        5 |              13.4 | false  |
| Carol |    91 |        2 |              45.5 | true   |
| Dave  |    74 |        4 |              18.5 | false  |
+-------+-------+----------+-------------------+--------+
The .round(1) call chains directly onto the expression — Narwhals expression chaining works the same way in both backends. You can chain as many transformations as you need before passing the expression to with_columns().
GroupBy and Aggregation
GroupBy operations are where pandas and polars diverge most sharply in their native APIs. Narwhals unifies them with a group_by().agg() pattern that works identically on both backends and produces the same result shape.
# groupby_agg.py
import narwhals as nw
import pandas as pd

sales_data = {
    "region": ["North", "South", "North", "East", "South", "East", "North"],
    "category": ["Electronics", "Clothing", "Electronics", "Clothing", "Electronics", "Electronics", "Clothing"],
    "revenue": [4200, 1800, 3100, 2400, 2900, 3600, 1500],
    "units": [14, 60, 10, 80, 29, 36, 50],
}

def regional_summary(df_native):
    df = nw.from_native(df_native, eager_only=True)
    summary = (
        df.group_by("region")
        .agg(
            nw.col("revenue").sum().alias("total_revenue"),
            nw.col("units").sum().alias("total_units"),
            nw.col("revenue").mean().round(0).alias("avg_deal_size"),
        )
        .sort("total_revenue", descending=True)
    )
    return nw.to_native(summary)

# Test with pandas
result = regional_summary(pd.DataFrame(sales_data))
print(result)
Output:
  region  total_revenue  total_units  avg_deal_size
0   East           6000          116         3000.0
1  North           8800           74         2933.0
2  South           4700           89         2350.0
The same function called with a polars DataFrame produces identical data (though polars formats the output differently). The key insight is that group_by().agg() is a Narwhals pattern — your code never touches df.groupby() (pandas) or df.group_by() (polars) directly, so there is no divergence to manage.

Schema Inspection and Type Handling
Narwhals exposes a unified schema that normalizes type names across backends. This is useful when you need to validate that a DataFrame has the expected columns and types before processing it.
# schema_check.py
import narwhals as nw
import pandas as pd
import polars as pl

def validate_and_describe(df_native):
    df = nw.from_native(df_native, eager_only=True)
    schema = df.schema
    print("Schema:", schema)
    print("Columns:", df.columns)
    print("Shape:", df.shape)

    # Check for required columns
    required = {"name", "age", "salary"}
    missing = required - set(df.columns)
    if missing:
        raise ValueError(f"Missing required columns: {missing}")

    # Narwhals dtype comparison works across backends
    for col, dtype in schema.items():
        print(f"  {col}: {dtype} (numeric={dtype.is_numeric()})")

pandas_df = pd.DataFrame({"name": ["Alice", "Bob"], "age": [30, 25], "salary": [75000, 62000]})
polars_df = pl.DataFrame({"name": ["Alice", "Bob"], "age": [30, 25], "salary": [75000, 62000]})

print("--- Pandas ---")
validate_and_describe(pandas_df)
print("\n--- Polars ---")
validate_and_describe(polars_df)
Output:
--- Pandas ---
Schema: {'name': String, 'age': Int64, 'salary': Int64}
Columns: ['name', 'age', 'salary']
Shape: (2, 3)
  name: String (numeric=False)
  age: Int64 (numeric=True)
  salary: Int64 (numeric=True)

--- Polars ---
Schema: {'name': String, 'age': Int64, 'salary': Int64}
Columns: ['name', 'age', 'salary']
Shape: (2, 3)
  name: String (numeric=False)
  age: Int64 (numeric=True)
  salary: Int64 (numeric=True)
The schemas are identical even though the underlying backends store and display types differently. dtype.is_numeric(), dtype.is_temporal(), and similar methods work consistently, so you can write type-based validation logic that runs on any backend without a lookup table of backend-specific type names.
Writing Backend-Agnostic Library Functions
The most powerful use of Narwhals is writing utility functions that you can publish in a library or share across a team, where callers may use different DataFrame libraries. The decorator @nw.narwhalify handles the wrap/unwrap automatically — no need to call from_native and to_native manually.
# library_utils.py
import narwhals as nw

@nw.narwhalify
def normalize_scores(df, score_col="score"):
    """Normalize a score column to 0-1 range. Works on any Narwhals-supported DataFrame."""
    col_min = df[score_col].min()
    col_max = df[score_col].max()
    return df.with_columns(
        ((nw.col(score_col) - col_min) / (col_max - col_min)).alias(f"{score_col}_normalized")
    )

@nw.narwhalify
def drop_nulls_and_report(df):
    """Drop null rows and print how many were removed."""
    original_len = len(df)
    cleaned = df.drop_nulls()
    dropped = original_len - len(cleaned)
    if dropped > 0:
        print(f"Dropped {dropped} rows with null values ({dropped/original_len:.1%} of data)")
    return cleaned

# Test with both backends
import pandas as pd
import polars as pl

pdf = pd.DataFrame({"student": ["Alice", "Bob", "Carol"], "score": [78, 95, 61]})
plf = pl.DataFrame({"student": ["Alice", "Bob", "Carol"], "score": [78, 95, 61]})

print("Pandas result:")
print(normalize_scores(pdf))

print("\nPolars result:")
print(normalize_scores(plf))
Output:
Pandas result:
  student  score  score_normalized
0   Alice     78          0.500000
1     Bob     95          1.000000
2   Carol     61          0.000000

Polars result:
shape: (3, 3)
+---------+-------+------------------+
| student | score | score_normalized |
| str     | i64   | f64              |
+=========+=======+==================+
| Alice   |    78 |             0.5  |
| Bob     |    95 |             1.0  |
| Carol   |    61 |             0.0  |
+---------+-------+------------------+
The @nw.narwhalify decorator wraps all DataFrame and Series arguments automatically when the function is called, then unwraps the return value back to the caller’s native type. This is the pattern to use when publishing functions in a shared library — it is the most Pythonic way to expose a Narwhals-powered API to callers who may not know or care that Narwhals is involved.

Real-Life Example: A Backend-Agnostic Sales Report Generator
This project builds a complete sales report generator that accepts any supported DataFrame, computes revenue metrics by region and category, flags underperformers, and returns a formatted summary. It is designed to be dropped into any project as a standalone utility.
# sales_report.py
import narwhals as nw
from typing import Any

@nw.narwhalify
def generate_sales_report(df, revenue_col="revenue", group_col="region", threshold_pct=0.8):
    """
    Generate a sales performance report grouped by region.
    Works with any Narwhals-supported DataFrame (pandas, polars, modin, etc.).

    Args:
        df: Any supported DataFrame with at minimum 'revenue' and 'region' columns.
        revenue_col: Name of the revenue column.
        group_col: Column to group by (default: 'region').
        threshold_pct: Groups below this fraction of the mean are flagged as underperformers.

    Returns:
        DataFrame with group totals, averages, deal counts, and performance flags.
        Return type matches the input type.
    """
    # Step 1: Group and aggregate
    summary = (
        df.group_by(group_col)
        .agg(
            nw.col(revenue_col).sum().alias("total_revenue"),
            nw.col(revenue_col).mean().round(0).alias("avg_deal"),
            nw.len().alias("deal_count"),
        )
        .sort("total_revenue", descending=True)
    )

    # Step 2: Compute overall mean for flagging
    mean_rev = summary["total_revenue"].mean()

    # Step 3: Add performance flag
    summary = summary.with_columns(
        (nw.col("total_revenue") < mean_rev * threshold_pct).alias("underperforming")
    )

    return summary


# --- Demo with pandas ---
import pandas as pd
import polars as pl

sample_data = {
    "region": ["North", "South", "North", "East", "South", "East", "West", "North", "West"],
    "category": ["SaaS", "Hardware", "SaaS", "Services", "Hardware", "SaaS", "Services", "Hardware", "SaaS"],
    "revenue": [12000, 8500, 9800, 15000, 7200, 11000, 4300, 6100, 9700],
    "sales_rep": ["Ana", "Ben", "Ana", "Cara", "Ben", "Cara", "Dan", "Ana", "Dan"],
}

print("=== Pandas Backend ===")
pandas_report = generate_sales_report(pd.DataFrame(sample_data))
print(pandas_report)
print(f"Return type: {type(pandas_report).__name__}\n")

print("=== Polars Backend ===")
polars_report = generate_sales_report(pl.DataFrame(sample_data))
print(polars_report)
print(f"Return type: {type(polars_report).__name__}")
Output:
=== Pandas Backend ===
  region  total_revenue  avg_deal  deal_count  underperforming
0   East          26000   13000.0           2            False
1  North          27900    9300.0           3            False
2  South          15700    7850.0           2             True
3   West          14000    7000.0           2             True
Return type: DataFrame

=== Polars Backend ===
shape: (4, 5)
+--------+---------------+----------+------------+-----------------+
| region | total_revenue | avg_deal | deal_count | underperforming |
| str    | i64           | f64      | u32        | bool            |
+========+===============+==========+============+=================+
| East   |         26000 |  13000.0 |          2 | false           |
| North  |         27900 |   9300.0 |          3 | false           |
| South  |         15700 |   7850.0 |          2 | true            |
| West   |         14000 |   7000.0 |          2 | true            |
+--------+---------------+----------+------------+-----------------+
Return type: DataFrame
Both backends produce the same data. The function is self-contained -- drop it into any project and it works regardless of which DataFrame library the project uses. To extend this project, add a category groupby dimension, compute month-over-month growth by joining with historical data, or build an HTML report using the aggregated summary. Because the return type matches the input, the result slots naturally into any downstream pipeline the caller already has.
Frequently Asked Questions
Does Narwhals support polars LazyFrame?
Yes. nw.from_native() wraps polars LazyFrame into a Narwhals LazyFrame, and the expression API works the same way. The main difference is that you cannot inspect rows or compute values until you call .collect() -- just like native polars lazy mode. When you call nw.to_native() on a Narwhals LazyFrame, you get a polars LazyFrame back (not a collected DataFrame). If you need the result immediately, call nw.to_native(result.collect()). Use eager_only=True in from_native() to raise an error if a LazyFrame is passed, which is useful for functions that need immediate results.
What do I do if Narwhals doesn't support an operation I need?
Narwhals covers the most common DataFrame operations (filter, select, with_columns, group_by, sort, join, drop_nulls, rename, schema inspection), but it does not wrap every method of every backend. If you need a backend-specific operation, you can always call nw.to_native(df) to drop back to the native DataFrame and use the native API directly. The typical pattern is: do as much as possible in Narwhals, then escape to native only for the specific operation that Narwhals does not cover. You can always wrap the result again with nw.from_native() to continue with the unified API afterward.
Does Narwhals add overhead?
The overhead is minimal -- Narwhals is a thin dispatch layer that translates method calls, not a data-processing engine. Each Narwhals expression compiles to a native expression at call time, and the underlying backend does the actual computation. For large datasets the dominant cost is the backend computation, not the Narwhals translation. Benchmarks from the Narwhals project show overhead in the microseconds range for typical operations. If you are processing tens of millions of rows, use polars directly where performance is the primary concern and Narwhals only at the interoperability boundaries.
Can I use Narwhals with Series, not just DataFrames?
Yes. nw.from_native(series, series_only=True) wraps a pandas or polars Series into a Narwhals Series with a unified API. You can use arithmetic, string methods (.str.to_lowercase(), .str.starts_with()), and datetime accessors (.dt.year(), .dt.month()) the same way across backends. The @nw.narwhalify decorator also handles Series arguments automatically when it detects them. This is useful for column-level utility functions that only need to transform a single column.
How does join work in Narwhals?
Narwhals supports df.join(other, on="key", how="inner") for inner, left, and anti joins. The syntax mirrors polars -- pass on for same-name keys or left_on / right_on for different-named keys. The how parameter accepts "inner", "left", and "anti". Cross joins and full outer joins are not universally supported across all backends and are currently out of scope for Narwhals. For those cases, escape to native as described in the previous FAQ.
When should I NOT use Narwhals?
Avoid Narwhals in three scenarios: (1) single-backend applications where you fully control the input type -- just use pandas or polars directly; (2) performance-critical inner loops where even microsecond overhead compounds -- use native polars there; (3) operations heavily relying on pandas-specific features like MultiIndex, Panel data, or in-place mutation -- Narwhals does not expose these. Narwhals is a tool for interoperability at function boundaries, not a replacement for mastering the individual backends.
Conclusion
Narwhals removes the choice between "support pandas" and "support polars" by making it unnecessary. The pattern is simple: nw.from_native() at the entry point of your function, Narwhals expressions for all your logic, and nw.to_native() at the exit. Or use @nw.narwhalify to handle the wrapping automatically. The unified schema API, expression system, and group_by().agg() pattern cover the vast majority of data transformation work you need to do at library boundaries.
The best next step is to take an existing utility function in your codebase that accepts a DataFrame and add Narwhals support to it. Pick a function with a clear input and output, wrap it with @nw.narwhalify, replace pandas-specific calls with Narwhals expressions, and run your tests against both backends. The migration is usually straightforward for filter, select, group_by, and with_columns operations. For the official documentation, the API reference, and the list of fully supported operations across backends, see narwhals-dev.github.io/narwhals/. The project is actively maintained and expanding its operation coverage with each release.
Related Articles
- How To Use Polars for Fast DataFrame Operations in Python
- How To Use Python Box for Dot-Notation Dict Access
- How To Use PyArrow for Parquet File Processing in Python
- How To Use Python Dask for Parallel Data Processing
- How To Use Python more-itertools for Advanced Iteration
- How To Use Python DuckDB for Analytical SQL
- How To Use Python PyGame for 2D Game Development
Further Reading: For more details, see the Python random module documentation.
Frequently Asked Questions
What is a Markov chain in simple terms?
A Markov chain is a mathematical model where the next state depends only on the current state, not on the sequence of events that preceded it. In text generation, this means the next word is predicted based only on the current word or phrase.
How does a Markov chain text generator work in Python?
A Python Markov chain text generator builds a dictionary of word transitions from training text. Each word maps to a list of words that follow it. The generator then randomly selects next words based on these observed probabilities to create new text.
What are the limitations of Markov chain text generation?
Markov chains produce text that can be grammatically inconsistent over long passages because they only consider local context (the previous few words). They lack understanding of meaning, coherence, and long-range dependencies that modern language models handle better.
Can I use Markov chains for purposes other than text generation?
Yes. Markov chains are used in weather prediction, stock market modeling, DNA sequence analysis, game AI, PageRank algorithms, and many simulation scenarios. Any system where transitions between states follow probabilistic rules can be modeled with Markov chains.
How do I improve the quality of Markov chain generated text?
Increase the chain order (use pairs or triples of words instead of single words as keys), use larger and higher-quality training data, add post-processing to fix grammar, and filter out nonsensical outputs. Higher-order chains produce more coherent text but require more training data.
Related Articles
- How To Build a Dashboard with Python and Dash
- How To Use Python Streamlit for Interactive Data Apps
- How To Analyze Networks and Graphs with NetworkX in Python
- How To Use SymPy for Symbolic Mathematics in Python
- How To Use NumPy Arrays for Scientific Computing in Python
- How To Create Plots and Charts with Matplotlib in Python
- Printing Text, Newlines, Format, Exceptions With Examples
Continue Learning Python
Tutorials you might also find useful: